You'll be able to easily view your order production performance directly on your Home page in the Sensaria Admin!
The production report can be extremely beneficial. Let's check out some of the benefits:
- It lets you see the production time history of your products being produced.
- It allows you to manage any production time issues and trends.
- Provides you with a better understanding of how long your orders take to get produced.
- You'll be able to set clear-cut expectations with your customers in terms of how long your products take to get produced.
Sensaria provides a production report that allows you to track the time it takes your orders to be in production. The report will display the different product categories and their correlated production time range in percentages within the defined business day ranges. The data provided in the report are specific to your orders in the system.
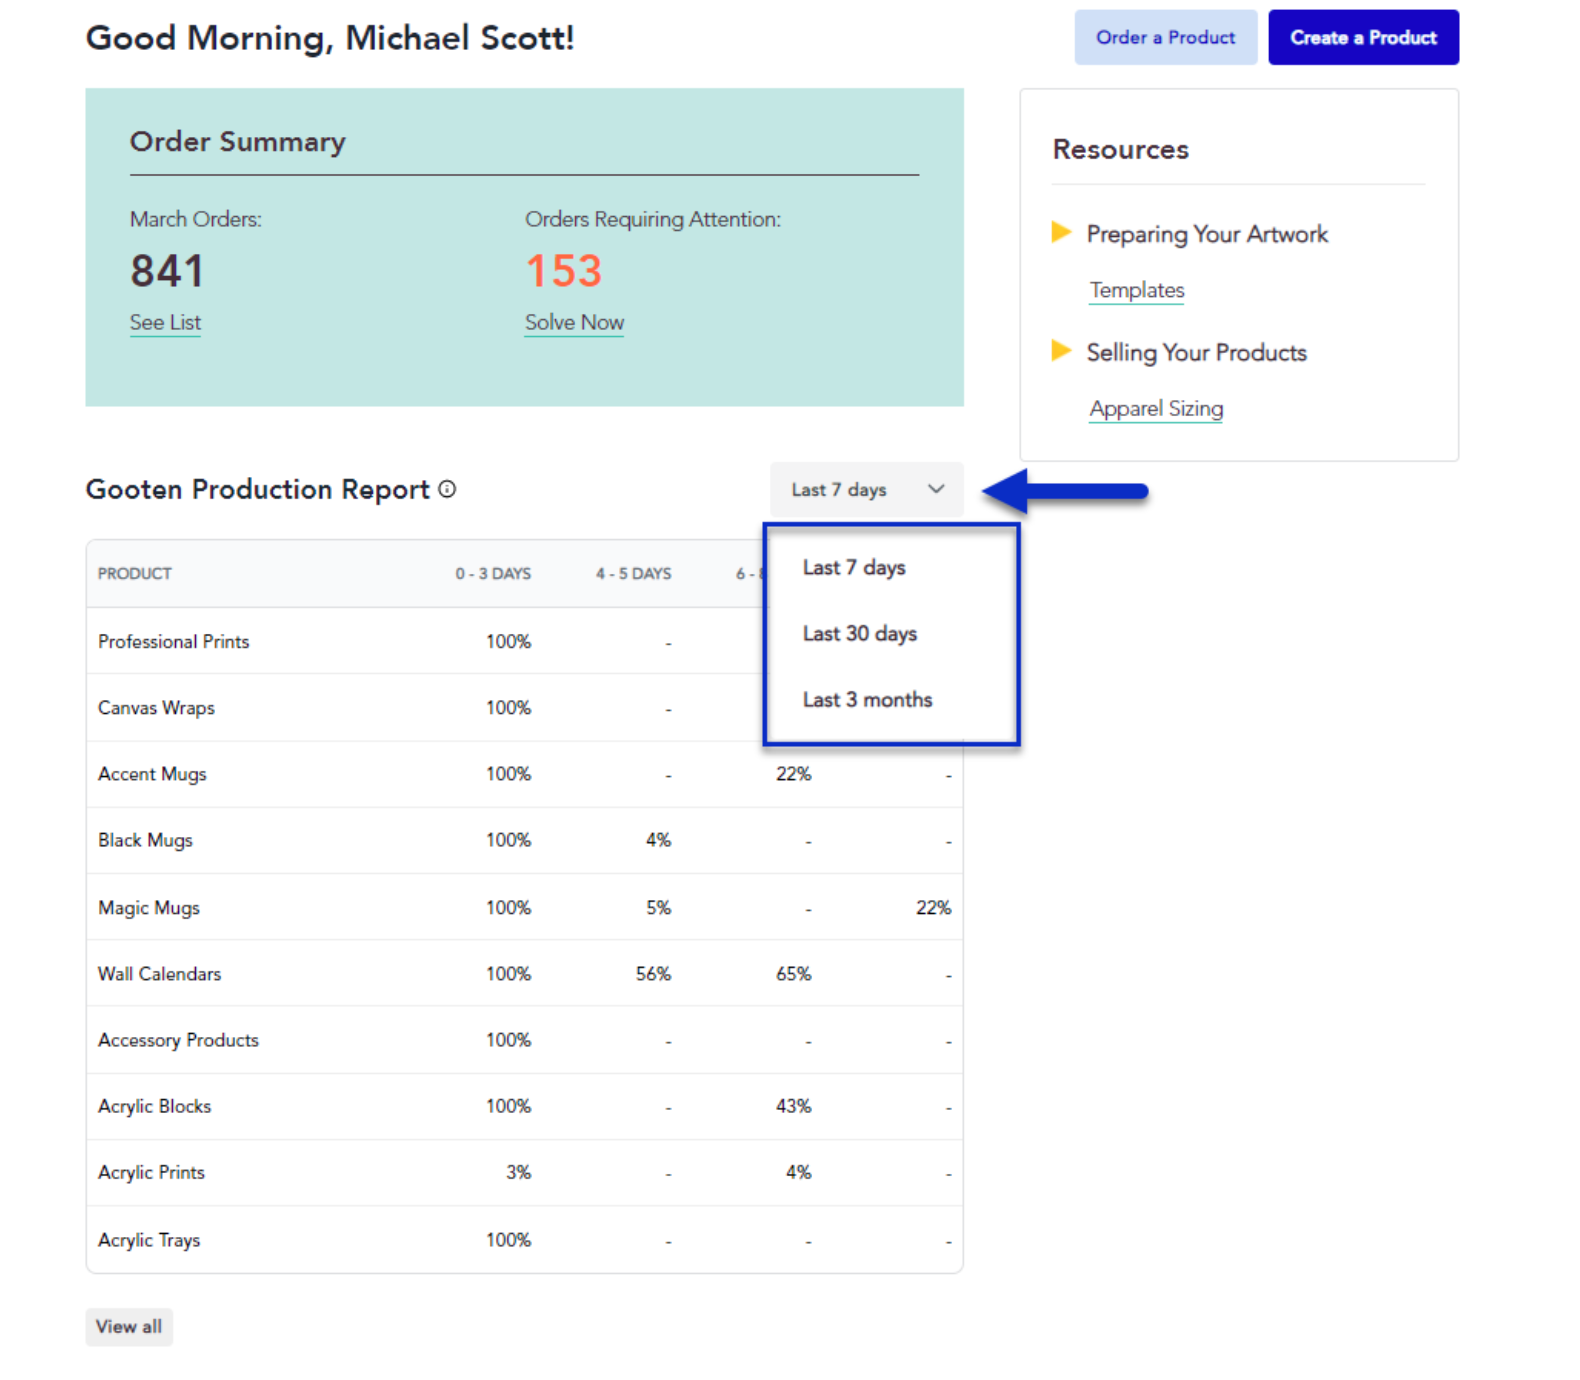
You can view your production time range for each product category for the last 7 business days, the last 30 business days, and the last 3 months.
- The data in this report is updated on a daily basis and refreshes every 24 hours.
- If a product has not been ordered within the last 3 months including the day you are viewing the report, the product will not appear in the report.
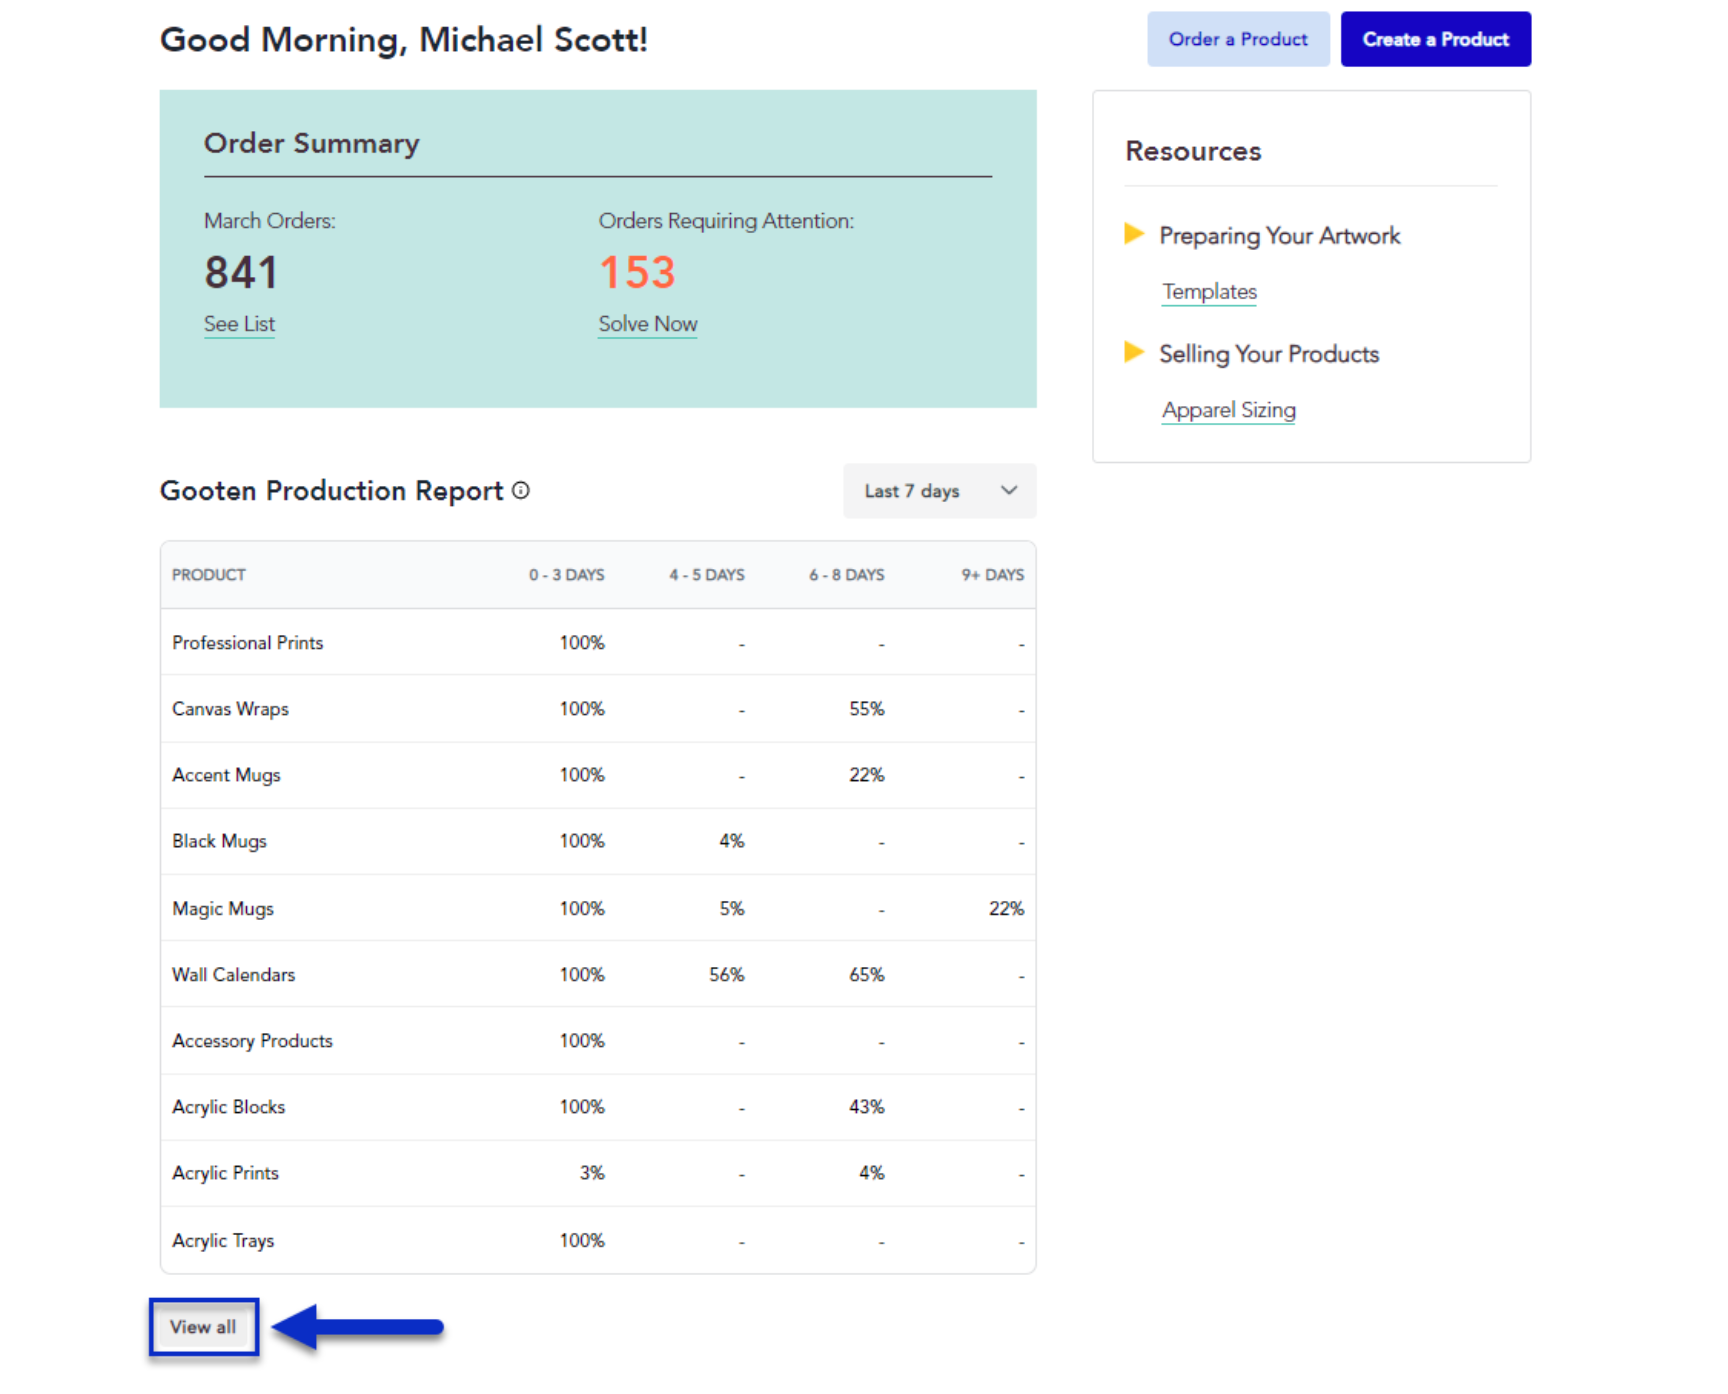
Let's check out the Sensaria production report!
At the top-right of the report, you can select how you want to filter your report data. You can view your production time range for the last 7 business days, the last 30 business days, and the last 3 months.
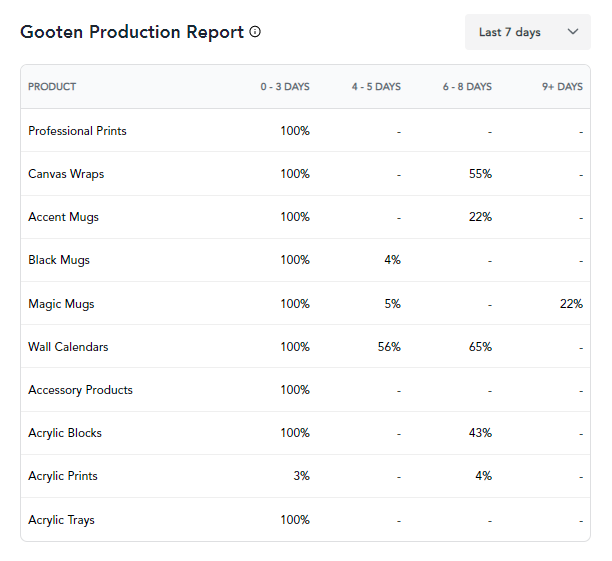
It will display the defined business day ranges and what percent of items are produced within those ranges. In the report, the product categories are on the left-most column. You'll then see the percentage and the number of products produced within the specific business day range columns.
You can also sort the table by clicking on the header of the column.
You may notice that the percentages in some columns may display either a "-" or "<1%". This is caused by not having percentage data available for the date range or caused by rounding the percentage.
- Your data will display "-" when there is no data available for the specific column.
- Your data will display "<1%" when there is an extremely small percentage of data available below 1%.
- For example, if there is a product category with a percentage of 0.4555%, it will display "<1%"
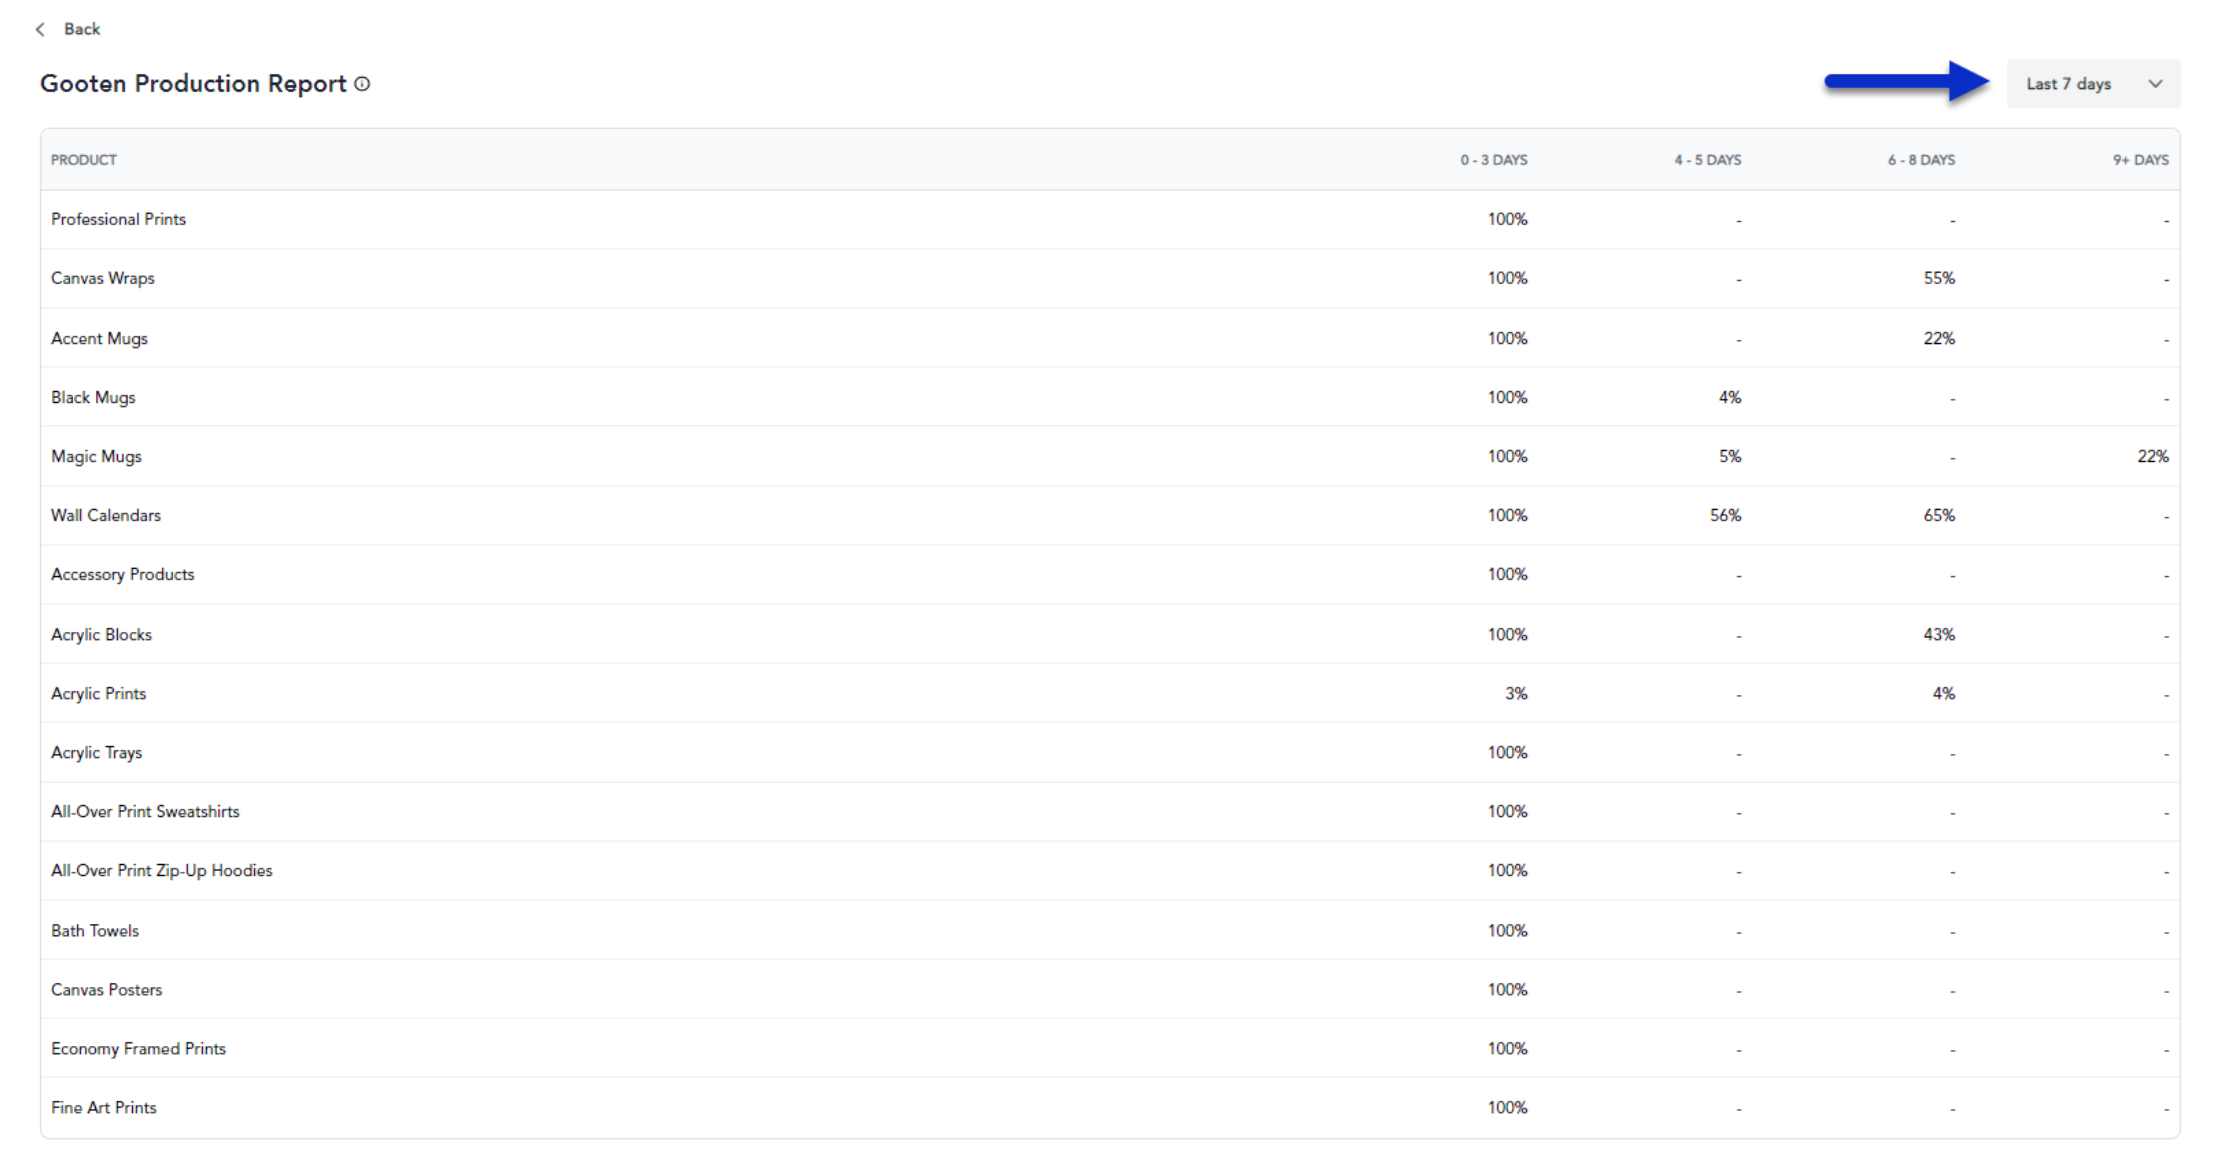
If you have a lot of different products being produced for your orders, you can click on the View all button to view the production time ranges for all your product categories.
This will show you an expanded version of your Sensaria Production Report with all of the product categories.
- You can also view your production time range for the last 7 business days, the last 30 business days, and the last 3 months similar to before using the dropdown in the top-right.
- To go back to the original Sensaria Production Report, you can click on the Back button at the top-left.